The release is scheduled for this morning. Your synthetic check passed overnight, the homepage loads quickly in a clean environment, and the dashboard looks reassuring. Then real users arrive: authenticated sessions hit an uncached search path, mobile tethering adds latency, a downstream service slows, and the checkout flow starts timing out while average response time still looks acceptable.
That failure is common because teams treat performance testing as a one-off speed check. Performance testing for web applications is a quality-assurance discipline. It verifies whether response-time, throughput, stability, accessibility, and recovery requirements hold under conditions that resemble production.
Table of Contents
- Why Performance Testing Matters Before Users Notice
- Defining Realistic Goals and Load Profiles
- Designing Test Scenarios That Mirror Real Users
- Choosing Tools and Running Your First Load Test
- Reading Results and Finding Real Bottlenecks
- Automating Performance Tests and Keeping Them Reliable
Why Performance Testing Matters Before Users Notice
A performance test should begin with a user-visible requirement, not a tool. The University of Illinois System's AITS Quality Assurance team defines performance testing around software response times and transaction rates, followed by verification that stated requirements have been met in its quality assurance testing guidance. That distinction gives the team something to operate against. “The site feels fast” is an impression. A response-time threshold, transaction target, and error boundary are conditions that can pass or fail.
Production failures usually emerge at service boundaries. Login may remain quick until the identity provider slows. Search can perform well with warm cache entries, then degrade for varied queries. Checkout may accept traffic while a database or payment dependency causes its queue to grow. Mean latency hides these cases because a small population of severely affected users disappears inside an otherwise healthy average.
The cost of testing only the happy path
A homepage check says little about the workload that determines whether users succeed. It may omit authentication, personalised data, write operations, asynchronous jobs, and third-party calls. A single test location, browser profile, or clean dataset also misses regional network conditions, cache variation, and accumulated application state.
Illinois accessibility governance applies the same real-condition principle. The state requires conformance testing against WCAG 2.1 Level AA and ARIA 1.2, combining automated checks with visual, keyboard, and assistive-technology verification, as described in the University of Illinois accessibility standards document. Performance and accessibility should be reviewed together. An interface that responds quickly but cannot be operated by keyboard users, or becomes unusable with assistive technology, still fails part of its audience.
Practical rule: Test the completed user journey, not only an endpoint. A successful request does not matter if the flow remains slow, inaccessible, or impossible to complete.
Regional sampling makes the same point for performance. Test from representative locations and connection types, then compare tail latency and failed-flow rates against the agreed SLOs. A single fast region can conceal a network path that makes the application unusable elsewhere.
Illinois guidance identifies automated accessibility testing as a starting point and recommends visual checks at a target width of 1280 px, according to the state web accessibility guidance. Performance testing benefits from that division of labour. Load generation provides coverage across users and conditions, while browser-level and human checks verify that the resulting interface remains usable.
A durable programme defines SLOs, samples realistic regions and networks, runs controlled and resilience workloads, observes each layer, and automates regression checks. The output is operational evidence that the application can meet its commitments before users encounter its limits.
Defining Realistic Goals and Load Profiles
Don't start with scripts. Start with an agreement among product, engineering, and operations about what “good” means. A useful performance plan ties each important user action to a measurable service-level objective, or SLO, then ties each SLO to a decision the team can make.
Start with user-facing SLOs
For every critical flow, define four measures:
- Response time: Choose the percentile that matters, usually a tail percentile such as p95 or p99 rather than an average. State whether it covers the API, server processing, browser interaction, or the complete journey.
- Throughput: Describe the work the system must sustain, such as successful searches, completed saves, or processed transactions. Requests per second can hide a system doing work that users do not need.
- Error behaviour: Set a boundary for failed requests, rejected transactions, timeouts, and partial responses. A fast error is still a failed user experience.
- Recovery: Define the expected result after overload, dependency failure, or a disrupted connection. The application may degrade gracefully, queue work, retry safely, or return a clear response.
These definitions settle the argument before execution. Product may call the application slow, engineering may point to an acceptable average, and operations may see an error spike. Shared criteria expose those differences and make the pass or fail decision explicit.
Use more than one workload
A baseline models ordinary activity and provides a repeatable comparison for each build. A spike applies an abrupt demand increase. A soak run sustains traffic long enough to expose resource leaks, queue growth, or gradual degradation. A breakpoint run keeps increasing pressure until the system violates its SLOs, then records the failure mode and recovery behaviour.
Illinois broadband guidance provides a useful model for measurement discipline. The Illinois BEAD performance measures testing guidance calls for repeated measurements across testing hours, covers download, upload, and latency, and defines explicit pass criteria, including 80% of speed measurements meeting 80% of the committed tier and 95% of latency tests at or below 100 ms. Those rules are not web-application SLOs, but the method transfers well. Define the test window, sampling frequency, population, and pass condition rather than relying on one impressive run.
Build regional profiles into the plan
A fast connection can hide failures elsewhere. Illinois regional reporting shows a median round-trip latency of 8.1 ms, with median download and upload speeds of 136.9 Mbps and 35.3 Mbps, respectively, in BroadbandNow's state comparison. That median describes a strong path, not every user or every time of day.
For Israel, nPerf's 2025 fixed-line barometer identifies latency as a differentiator for interactive workloads. Build at least three client profiles: local fibre, mid-tier consumer broadband, and mobile tethering. Measure p95 and p99 behaviour for each profile, then introduce jitter, packet loss, and delayed round trips. These conditions expose regressions that a high-bandwidth path can conceal.
A plan is ready when someone outside QA can answer three questions without interpretation: which journeys are tested, which measurements determine failure, and what the team will change when a threshold is missed. Keep the SLOs, profiles, datasets, and acceptance rules in one reviewable plan with this performance testing strategy guide.
Designing Test Scenarios That Mirror Real Users
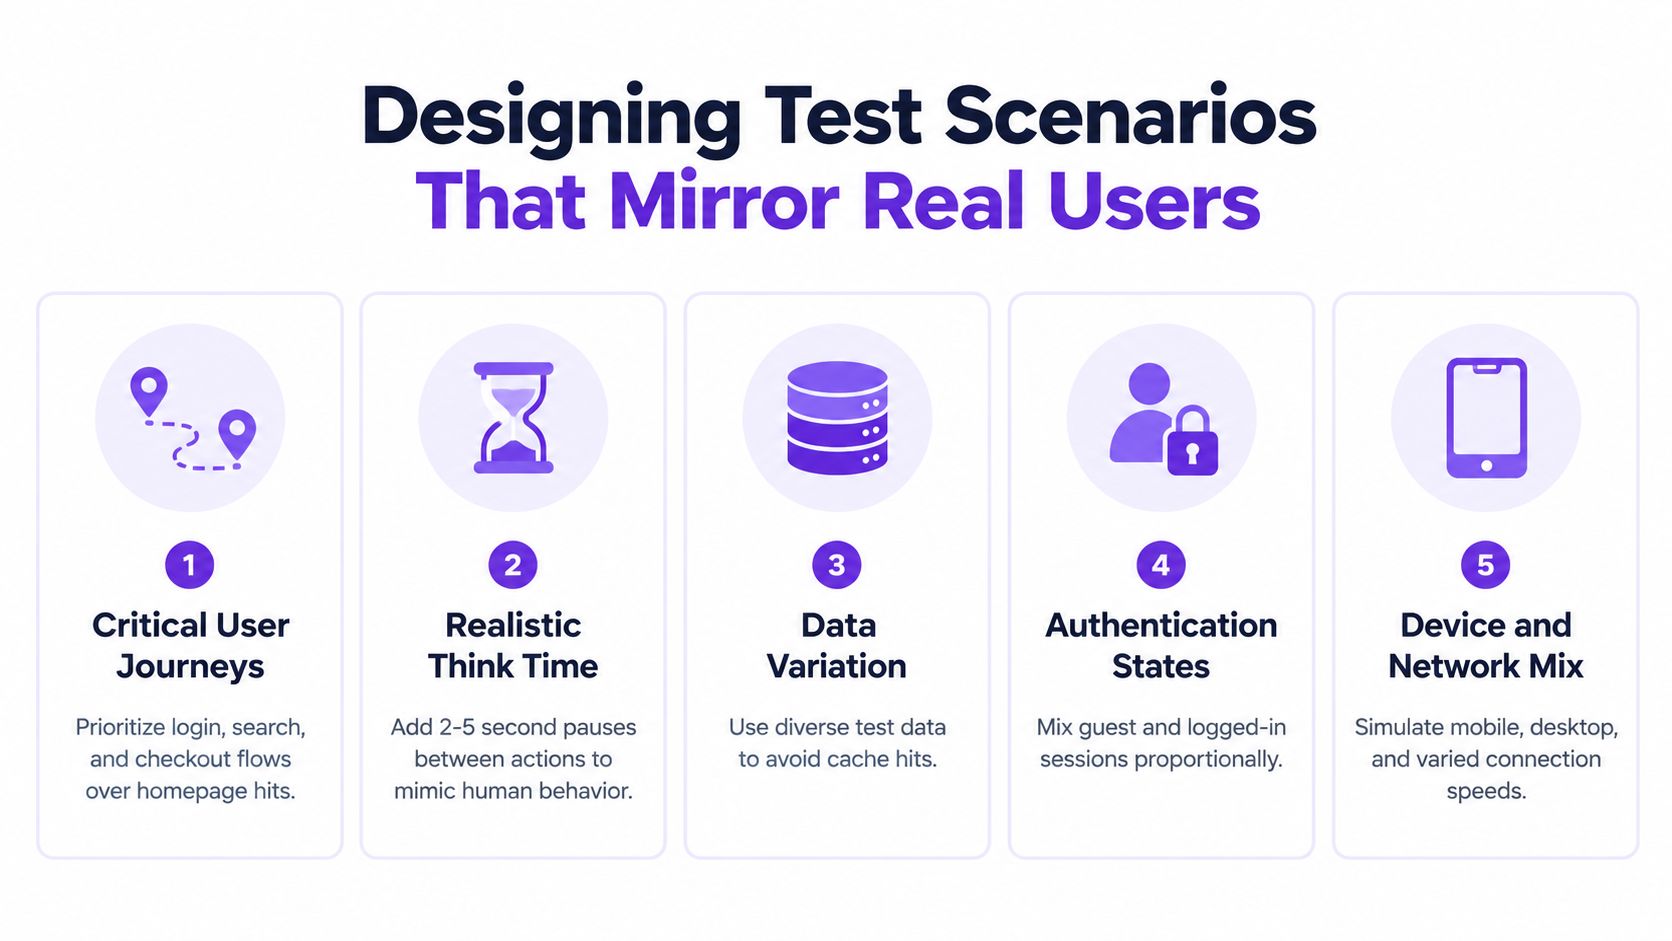
A credible workload represents a user population, not a row of identical robots. If every virtual user requests the same public page with identical parameters, caches absorb much of the traffic and the test measures an artificial shortcut.
Start with journeys that carry business or operational risk. Login, search, checkout, account updates, file uploads, and reporting usually reveal more than repeated homepage requests. Map every journey as ordered actions, including redirects, token refreshes, reads, writes, background requests, and expected responses. Tie each journey to an SLO, such as a latency threshold for a completed action, an error-rate limit, or a completion requirement under degraded network conditions.
Give each scenario a believable shape
Users pause, revise choices, and submit different data. Add think time and pacing between actions so the workload does not produce an impossible burst pattern. The infographic uses 2 to 5 second pauses as a visual example, while production telemetry should determine the distribution for your application.
Parameterise data deliberately:
- Search terms: Vary terms and filters so database queries and cache behaviour resemble production.
- Accounts and permissions: Mix guest, registered, administrative, and restricted users when those states change the request path.
- Records and payloads: Include small and large objects, empty results, long lists, and update operations.
- Session state: Reuse sessions where real users do, but prevent one shared token from turning every request into an unrealistic shortcut.
Authentication often changes the result more than expected. A test using only logged-in users can overstate cache warmth, while a guest-only test omits identity-provider calls and session storage. Model the mixture your application serves, then verify that test data is anonymised and safe. Record the request mix, arrival pattern, and threshold outcome so another engineer can reproduce the run.
Add browser and network reality
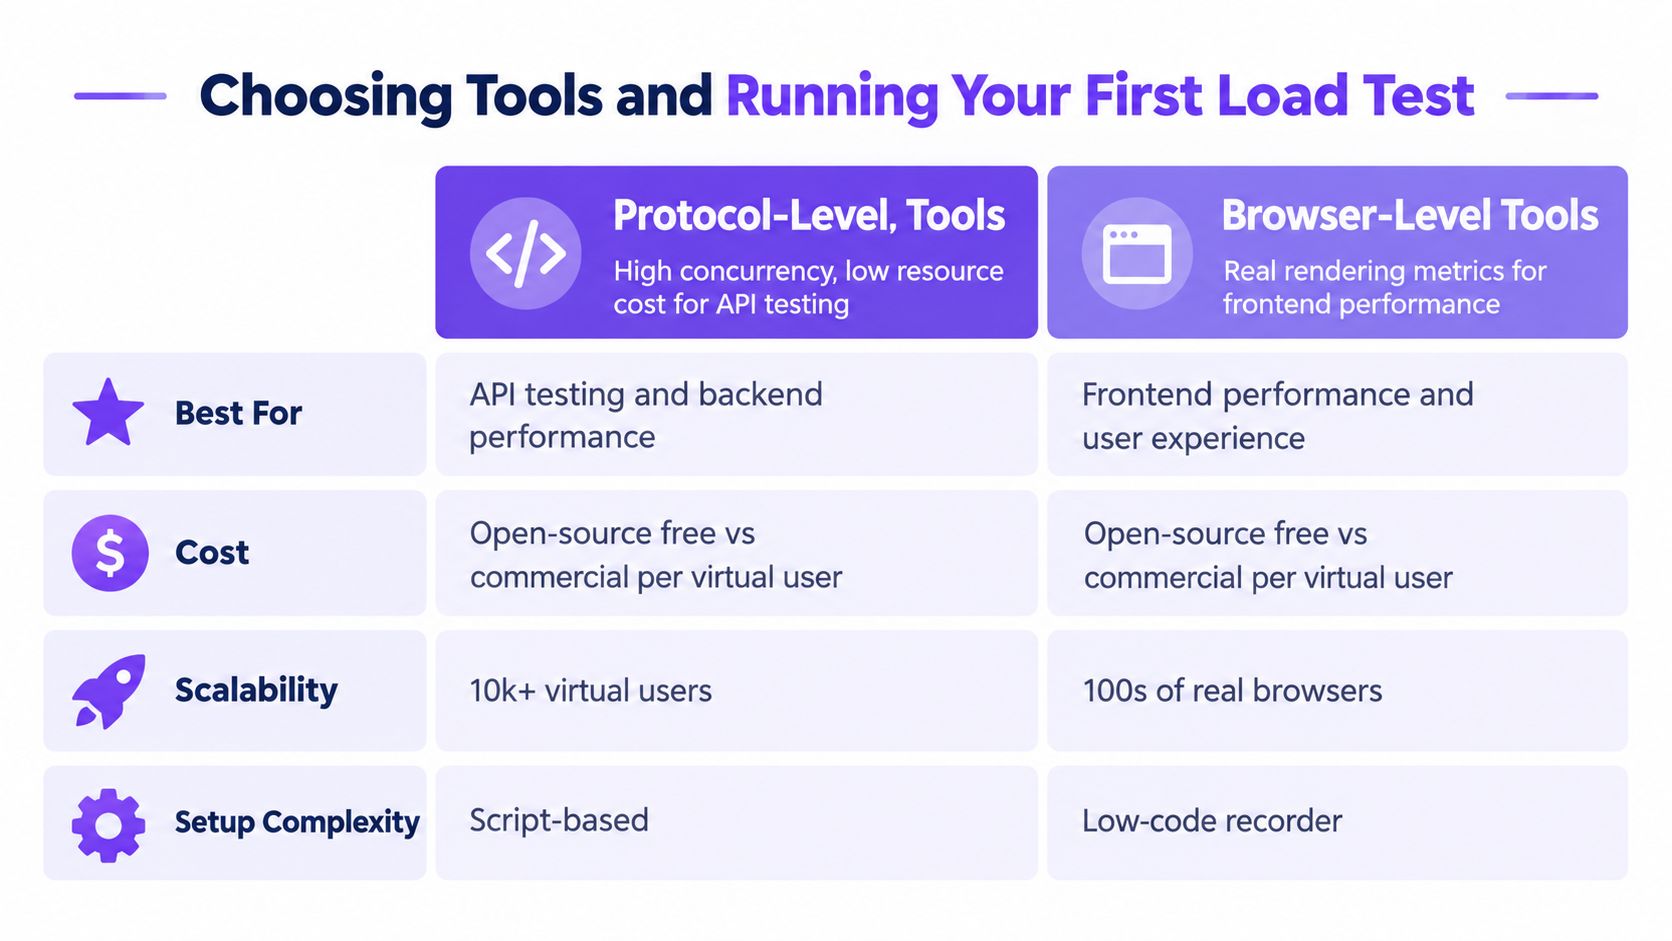
Protocol-level tests use fewer resources and suit API or service-capacity checks. Browser-level tests expose rendering, JavaScript execution, layout shifts, interaction readiness, and accessibility behaviour. Use both when the failure can occur between the backend response and the user-visible interface.
Apply the regional profiles defined earlier during execution. Illinois has strong median network conditions, but that path does not represent every user or every period of congestion. Include mobile tethering, variable latency, packet loss, and degraded dependency paths. Compare p95 and p99 results by profile, not only the overall average, and test whether each journey still meets its SLO when the network or a downstream service worsens.
Visual and keyboard checks belong beside the same important journeys. Illinois guidance states that content must not flash faster than 3 times per second, as documented in the Illinois web implementation guidelines. Automated load scripts cannot reliably show whether a focus indicator disappears, a modal traps keyboard users, or motion becomes unsafe. Pair performance results with manual visual, keyboard, and assistive-technology checks.
A reusable scenario checklist should record the journey, actor, authentication state, data variation, pacing, browser, device, network, dependency assumptions, SLO, and pass or fail rule. If a script cannot explain which user behaviour it represents, exclude it from release decisions. For the distinction between traffic generation and broader system validation, see this guide to performance testing versus load testing.
Choosing Tools and Running Your First Load Test
Choose the tool after defining the workload and the SLO you need to verify. Protocol-level generators such as k6, Gatling, JMeter, and Locust can create substantial API traffic with comparatively modest execution overhead. Browser-level tools provide rendering and interaction signals, but each browser session consumes more resources and demands tighter control of browsers, devices, and network conditions.
Open-source tools suit teams that can maintain scripts, runners, dashboards, and result storage. Commercial platforms can reduce setup effort, provide managed browser capacity, and package reports. The trade-off is broader than licence cost. Compare execution control, operational ownership, script complexity, regional coverage, and the fidelity of the user experience you need to observe.
Open-loop and closed-loop models
A closed-loop generator waits for a virtual user request to complete before starting the next action. That mirrors a session flow, but a slow system can then make the generator send less work, hiding the pressure under investigation. An open-loop model schedules arrivals independently of response time. It is better for testing queueing and saturation when production traffic can arrive faster than the application completes it.
Use closed-loop behaviour for realistic sessions. Use open-loop arrivals when the risk is an arrival rate that remains high while completion slows. The Illinois research concept behind open-loop load generators is useful here: the generator must preserve the intended arrival pattern rather than adapting it to system latency.
A controlled first run
Start with a small, observable run. Verify test accounts, data reset rules, tracing, logs, application metrics, database telemetry, and dependency stubs before increasing pressure. Ramp gradually and hold each stage long enough to separate warm-up from steady state. Stop when the test threatens shared infrastructure.
Run the same profile from the regions that matter to the SLO. Regional network paths can change latency, loss, and dependency behaviour, so a passing local run does not establish user experience elsewhere. Record results by region and profile, then use threshold sampling to check whether the slowest sampled paths still meet the agreed SLO. Add a resilience case that worsens a dependency or network path, and verify that errors, retries, and recovery remain within the release rule.
Capture:
- User signals: p50, p95, p99, completed transactions, timeouts, and error classes.
- Application signals: CPU, memory, garbage collection, thread or event-loop pressure, queue depth, and connection pools.
- Data signals: database waits, lock contention, query duration, cache hit behaviour, and storage activity.
- Dependency signals: downstream latency, retry volume, circuit-breaker state, CDN behaviour, and provider errors.
| Tool Pattern | Best For | Trade Off | When to Avoid |
|---|---|---|---|
| Protocol-level open-source | API capacity and repeatable CI checks | Requires scripting and observability work | Avoid when browser rendering is the primary risk |
| Browser-level automation | Front-end responsiveness and interaction flows | Higher resource use and more fragile execution | Avoid as the only method for high-concurrency API capacity |
| Managed commercial platform | Teams needing hosted runners and packaged reporting | Less control over execution details and ongoing cost | Avoid when strict data residency or custom infrastructure is required |
| Distributed self-hosted runners | Controlled execution across selected regions | Your team owns scaling, patching, and result collection | Avoid when operational ownership is already a bottleneck |
The first useful test is the smallest run that produces trustworthy telemetry and a repeatable baseline. Increase load only after the team can explain each signal, compare regional SLO results, and identify the failure behaviour the test is meant to expose.
Reading Results and Finding Real Bottlenecks
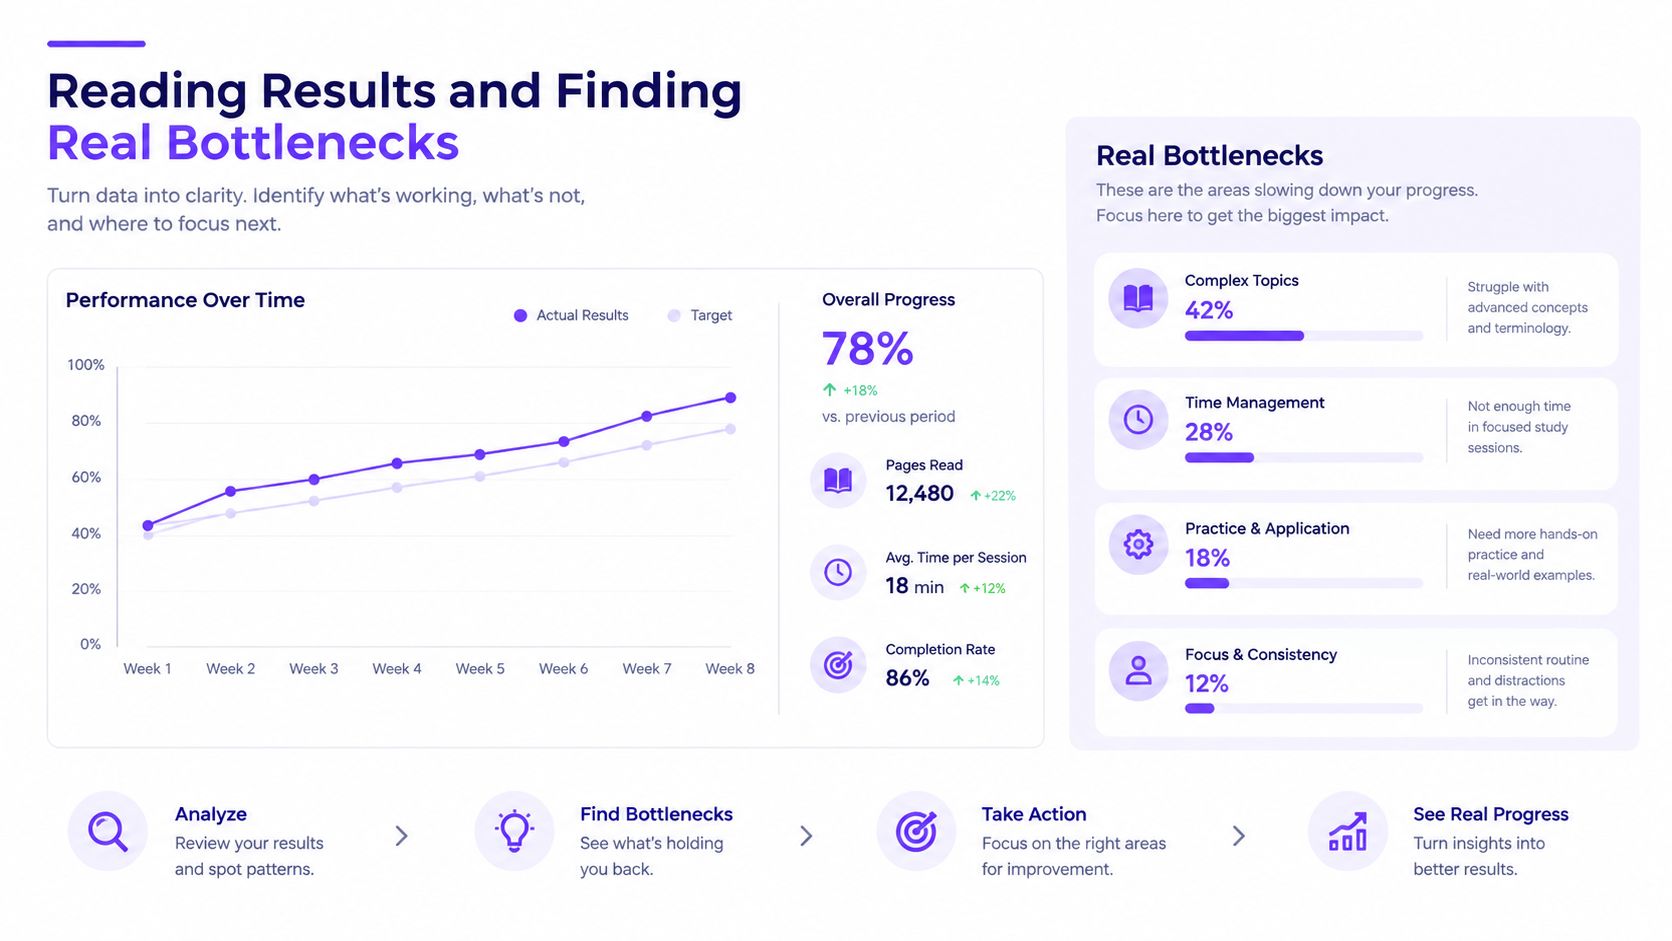
Average response time is a summary, not a diagnosis. A service can show an acceptable average while a significant tail of requests waits behind a saturated pool, slow query, retry storm, or failing dependency. Start with the user-facing SLO, then examine the evidence that explains whether it is being met.
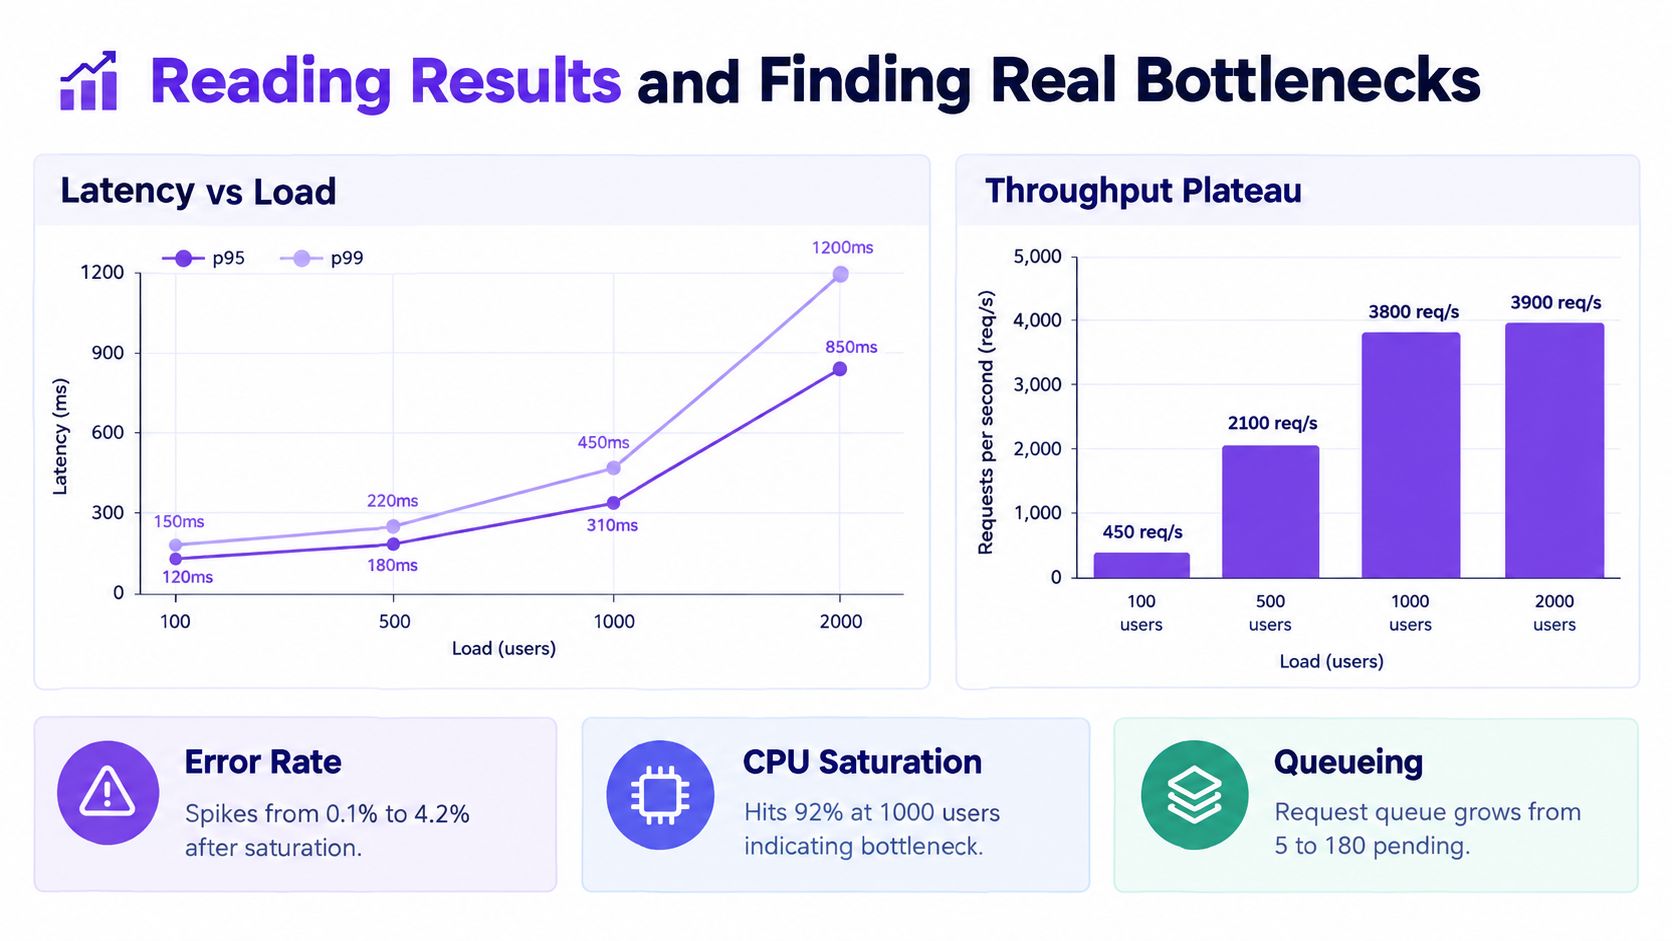
Read percentiles with throughput and errors. Rising p95 while throughput keeps increasing often indicates a constrained resource. A throughput plateau with increasing concurrency means additional users are waiting instead of receiving useful work. If p99 rises sharply before p95, inspect outliers, retries, cold paths, and dependency variance rather than tuning the median request.
Follow the saturation signal
The dashboard below shows the patterns to inspect: latency bending upward, throughput flattening, and resource pressure appearing near the same workload. Its values are visual examples supplied with the asset, not a universal benchmark.
Align request latency, queue depth, CPU, memory, database waits, connection pools, downstream calls, and error classes on one timeline. A rising queue with idle CPU suggests a different constraint from high CPU with a stable queue. Database wait limited to one journey points toward a query or lock path, not an immediate need for more application instances.
Read the failure shape before changing the system. A larger machine may hide saturation temporarily while leaving the queueing mechanism, query pattern, or dependency failure untouched.
Use repeated measurements rather than a single run. Execute the same scenario across separate windows, compare distributions, and record whether the SLO violation is persistent, intermittent, or limited to a network profile. This separates an application bottleneck from regional variation and prevents a one-off result from driving an expensive change.
Test the failure you expect
Happy-path speed does not cover distributed-system failure. In 2025, Canvas @ Illinois was restored after a broader AWS outage, a reminder that recovery and dependency behaviour can matter as much as isolated response time. The incident is discussed in University of Illinois research repository material, alongside broader discussion of realistic workload generation.
For an Israeli audience, Cloudflare Radar's Israel network quality view provides a regional baseline. A strong network environment still has variation, so test round-trip-time inflation, packet loss, and partial CDN degradation. Compare the resulting SLO distributions by region instead of hiding regional failures inside a global average.
Do not add indexes, increase instance size, or rewrite a service because one graph looks uncomfortable. Identify the dominant wait, reproduce it, confirm the affected journey, and test the smallest corrective change. Rerun the same workload and compare the full distribution, error classes, throughput, and recovery behaviour.
For database-heavy systems, use a database performance optimisation review to examine query plans, lock behaviour, pool limits, and data access patterns together. The fix may be a query change, pool adjustment, dependency timeout, or workload limit rather than more compute.
Automating Performance Tests and Keeping Them Reliable
A performance test becomes valuable when the team can run it repeatedly without turning every deployment into an operations incident. Keep a small baseline suite in CI, trigger broader load, spike, soak, and resilience runs on a deliberate schedule, and reserve high-risk scenarios for releases that change traffic shape, data access, infrastructure, or dependencies.
Put evidence into the delivery path
Version the scripts with application code. Version the test data model and seed process as well, because a workload that changes its dataset can invalidate comparisons. Store environment assumptions beside the test, including service versions, feature states, cache policy, and observability requirements.
Use deployment gates that reflect risk:
- Fast regression gate: Run a short, representative scenario and fail on clear SLO violations or new error classes.
- Release qualification: Execute a wider mix of journeys and network profiles before a significant production change.
- Reliability exercise: Run soak, breakpoint, failover, and dependency-degradation tests when the architecture or operating model changes.
- Production feedback loop: Compare synthetic results with real traces, resource signals, and incident findings after release.
Feature flags can help you expose a performance-sensitive path gradually, but they also create combinations that need coverage. If road maps and flag states are becoming difficult to reason about, a focused feature management approach can keep rollout decisions separate from test logic. Use it only where flags are a part of the workload and release risk.
Prevent flaky automation
Flakiness usually comes from unstable data, shared environments, uncontrolled dependencies, generator saturation, or thresholds that ignore natural variance. Isolate test accounts, make cleanup deterministic, monitor the load generators themselves, and distinguish infrastructure failure from application failure in the result report.
The next actions are concrete:
- Write SLOs for the most important user journeys.
- Create baseline, spike, soak, breakpoint, and dependency-degradation profiles.
- Run local fibre, consumer broadband, and mobile-tethered client conditions where regional variance matters.
- Instrument application, database, queue, cache, and downstream dependency signals.
- Add a small CI regression gate, then expand coverage as results become trustworthy.
- Review production incidents against the scenarios you test.
Performance isn't maintained by a single successful run. Teams maintain it by connecting measurable thresholds, realistic traffic, regional conditions, failure behaviour, and deployment decisions into one operating loop.
Ryware designs and tests web applications with load, stress, soak, spike, and scalability scenarios, supported by tracing, application profiling, and CI-integrated regression gates. Visit Ryware to discuss a practical performance-testing plan for your application, cloud platform, or production reliability programme.